Charts
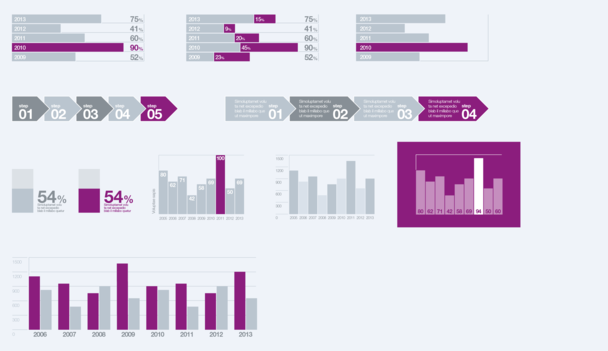
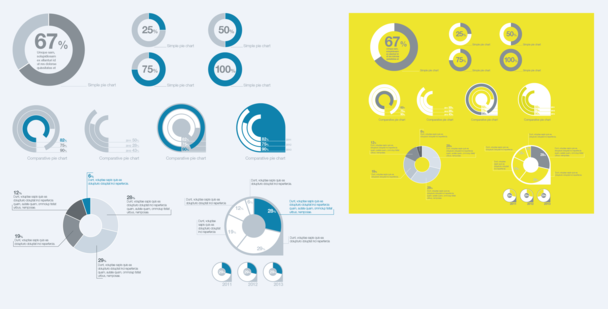
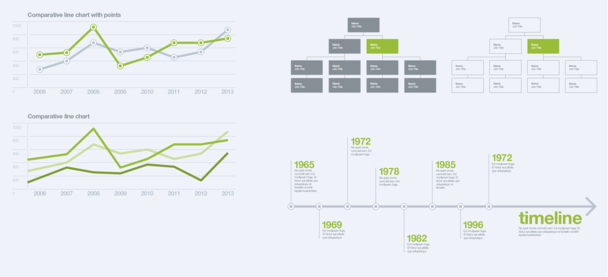
The following pages provide chart models for brochures and other documents. Charts must be kept simple to express the information they contain as clearly as possible.
Colours should contrast and their number belimited to ensure optimal readability.
Charts should be principally made up from primary and secondary palettes; the highlights palette should only be used to highlight a single item.
Please use only one highlight colour per chart or per page.
Data tables
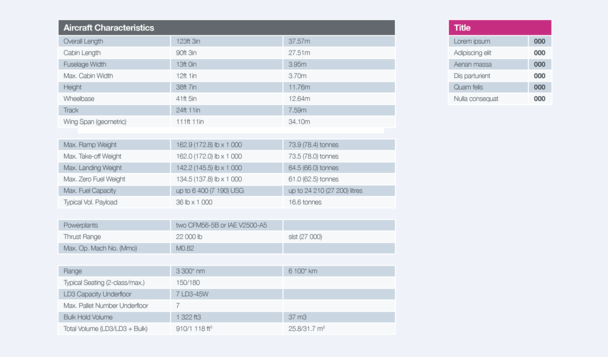
Data tables should follow the above principle and should mainly use the primary colour palettes.
To highlight specific items, either invert the colour of typeface and background or use one highlight colour per table.
Arrows
A set of arrows has been developed to point out specific information.
The arrows are available in different stroke weights as well as dotted strokes.
All colour palettes can be used.

Quote boxes
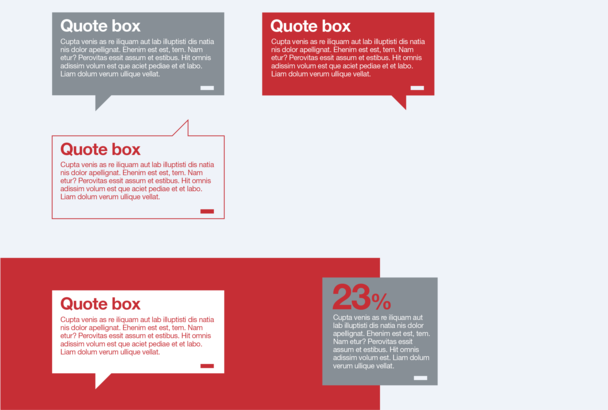
A set of quote boxes has been developed to highlight specific information.
To maximise impact, quotes must be kept short. Quote boxes exist in outline, dotted outline or in solid colour.
All colour palettes can be used for the quote box as well as the text they contain.
Maps
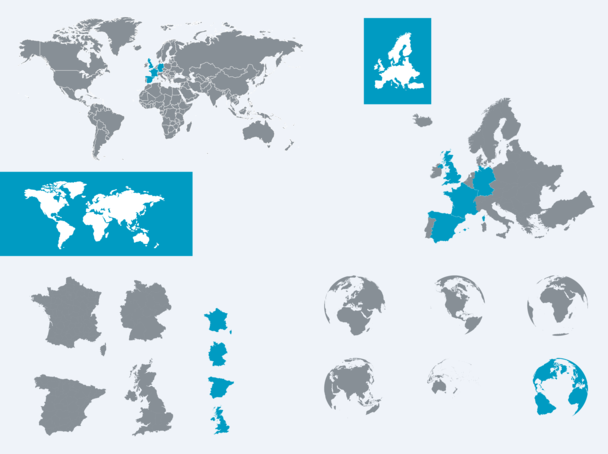
A set of maps has been developed for use in brochures and other documents.
For small sizes, use the simple map.
All colour palettes can be used.
Keyline
Carbon grid

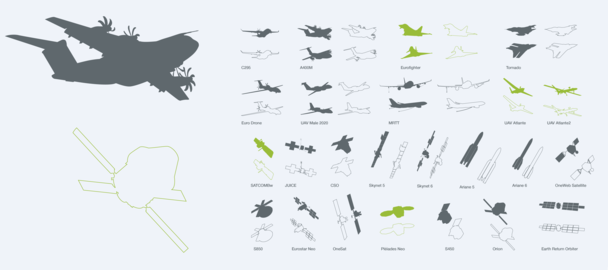
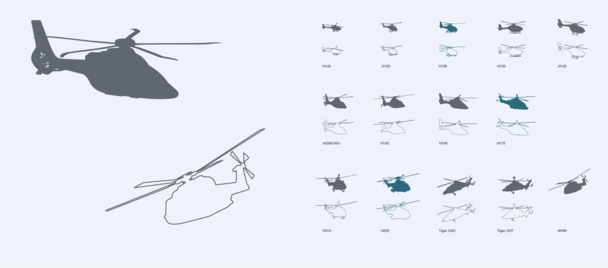
Product silhouettes
A set of product silhouettes has been developed for use in brochures and other documents.
These silhouettes can be used in different colours, according to the defined colour palette.
